Item:OSW123e4567e89b12d3a456426614174000
| Python Evaluation from Chatbot 2025-07-29_17-34 ID: OSW123e4567e89b12d3a456426614174000 | UUID: 123e4567-e89b-12d3-a456-426614174000 | |
|---|---|
| ID | OSW123e4567e89b12d3a456426614174000 |
| UUID | 123e4567-e89b-12d3-a456-426614174000 |
| Label | Python Evaluation from Chatbot 2025-07-29_17-34 |
| Machine compatible name | PythonEvaluationFromChatbot202507291734 |
| Types/Categories | Python Evaluation Process |
 |
|
| Statements (outgoing) | |
| Statements (incoming) | |
|
|
|
| Details | |
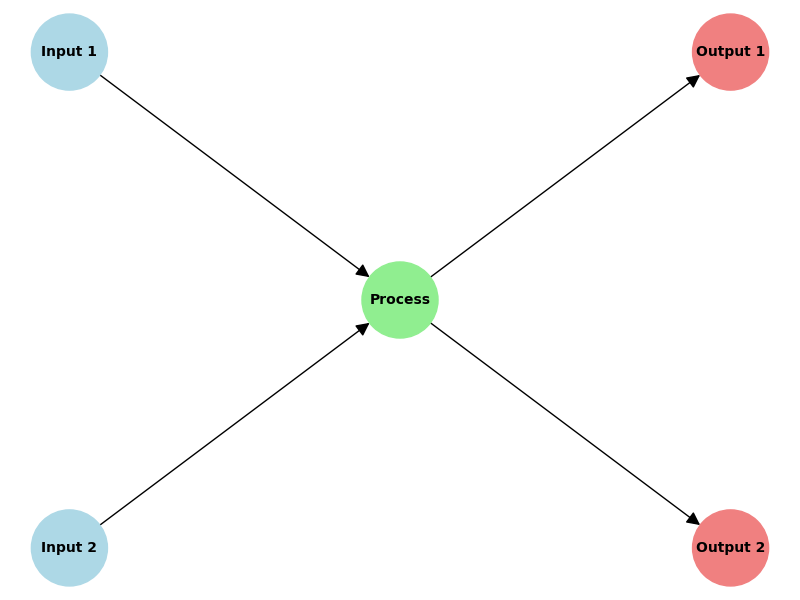
import networkx as nx
G = nx.DiGraph()
G.add_node("Input 1", color='lightblue') G.add_node("Input 2", color='lightblue') G.add_node("Process", color='lightgreen') G.add_node("Output 1", color='lightcoral') G.add_node("Output 2", color='lightcoral')
G.add_edges_from([ ("Input 1", "Process"),
("Input 2", "Process"),
("Process", "Output 1"),
("Process", "Output 2")
])
pos = { "Input 1": (-1, 1), "Input 2": (-1, -1), "Process": (0, 0), "Output 1": (1, 1), "Output 2": (1, -1) }
plt.figure(figsize=(8, 6)) node_colors = [nx.get_node_attributes(G, "color")[node] for node in G.nodes()] nx.draw(G, pos, with_labels=True, node_size=3000, node_color=node_colors, font_size=10, font_weight='bold', arrowsize=20) plt.title("Process Flow Diagram") plt.savefig("/tmp/output.png") plt.show()
| |
| Item | |
|---|---|
| Type(s)/Category(s) | Python Evaluation Process |
Python-Code
import matplotlib.pyplot as plt
import networkx as nx
# Create a directed graph
G = nx.DiGraph()
# Add nodes for inputs and outputs
G.add_node("Input 1", color='lightblue')
G.add_node("Input 2", color='lightblue')
G.add_node("Process", color='lightgreen')
G.add_node("Output 1", color='lightcoral')
G.add_node("Output 2", color='lightcoral')
# Add edges to represent the process flow
G.add_edges_from([
   ("Input 1", "Process"),
   ("Input 2", "Process"),
   ("Process", "Output 1"),
   ("Process", "Output 2")
])
# Define positions of nodes
pos = {
   "Input 1": (-1, 1),
   "Input 2": (-1, -1),
   "Process": (0, 0),
   "Output 1": (1, 1),
   "Output 2": (1, -1)
}
# Draw the graph
plt.figure(figsize=(8, 6))
node_colors = [nx.get_node_attributes(G, "color")[node] for node in G.nodes()]
nx.draw(G, pos, with_labels=True, node_size=3000, node_color=node_colors, font_size=10, font_weight='bold', arrowsize=20)
plt.title("Process Flow Diagram")
plt.savefig("/tmp/output.png")
plt.show()
Graph
QR Code
Attachments
jsondata
| uuid | "123e4567-e89b-12d3-a456-426614174000" | |||||
|---|---|---|---|---|---|---|
| name | "PythonEvaluationFromChatbot202507291734" | |||||
| label |
| |||||
| image | "File:OSW07ef97b871ee4cb78b4579f6e53c5d95.png" | |||||
| meta |
| |||||
| type |
| |||||
| output |
| |||||
| python_evaluation_code | "import matplotlib.pyplot as plt import networkx as nx # Create a directed graph G = nx.DiGraph() # Add nodes for inputs and outputs G.add_node("Input 1", color='lightblue') G.add_node("Input 2", color='lightblue') G.add_node("Process", color='lightgreen') G.add_node("Output 1", color='lightcoral') G.add_node("Output 2", color='lightcoral') # Add edges to represent the process flow G.add_edges_from([ ("Input 1", "Process"), ("Input 2", "Process"), ("Process", "Output 1"), ("Process", "Output 2") ]) # Define positions of nodes pos = { "Input 1": (-1, 1), "Input 2": (-1, -1), "Process": (0, 0), "Output 1": (1, 1), "Output 2": (1, -1) } # Draw the graph plt.figure(figsize=(8, 6)) node_colors = [nx.get_node_attributes(G, "color")[node] for node in G.nodes()] nx.draw(G, pos, with_labels=True, node_size=3000, node_color=node_colors, font_size=10, font_weight='bold', arrowsize=20) plt.title("Process Flow Diagram") plt.savefig("/tmp/output.png") plt.show()" |